Fast Data – Akka, Spark, Kafka and Cassandra
With the proliferation and ease of access to hardware sensors, the reality of connected devices to the Internet has become much more prevalent in the past couple of years. Now it is not just the computers and mobile phones, but a plethora of devices like medical sensors, traffic sensors, smart meters and many more are connected to the Internet and exchanging vast amount of data with extremely high velocity. This is allowing us to solve a number of problems of pertinent to medical field, environment, smart city use cases and so forth. The emergence of IoT (Internet of Things) has also raised the need to be able to process not just large amount of data efficiently, but also to be able to process them in near real time for various purposes including dashboards, monitoring, predictive analysis and preventive measures.
In this post we will look at a quick introduction to some of the technologies in the forefront of addressing the various facets of challenges involved in solving big and fast data. We also present a full working example implemented in Scala for the discussed use case. The code can be found on GitHub at the following location.
https://github.com/kunnum/sandbox/tree/master/spark-kafka
Context
The use case addressed is a simple smart city use case, where readings from smart electricity readers installed in a large number of residential premises across various cities are sending current readings periodically to centralised servers. The need is to gather the data and maintain a realtime dashboard of the total power usage in each city. The solution requires to process the fine-grained meter readings streaming in at a high velocity, aggregate them by city and store it durably for subsequent efficientanalysis.
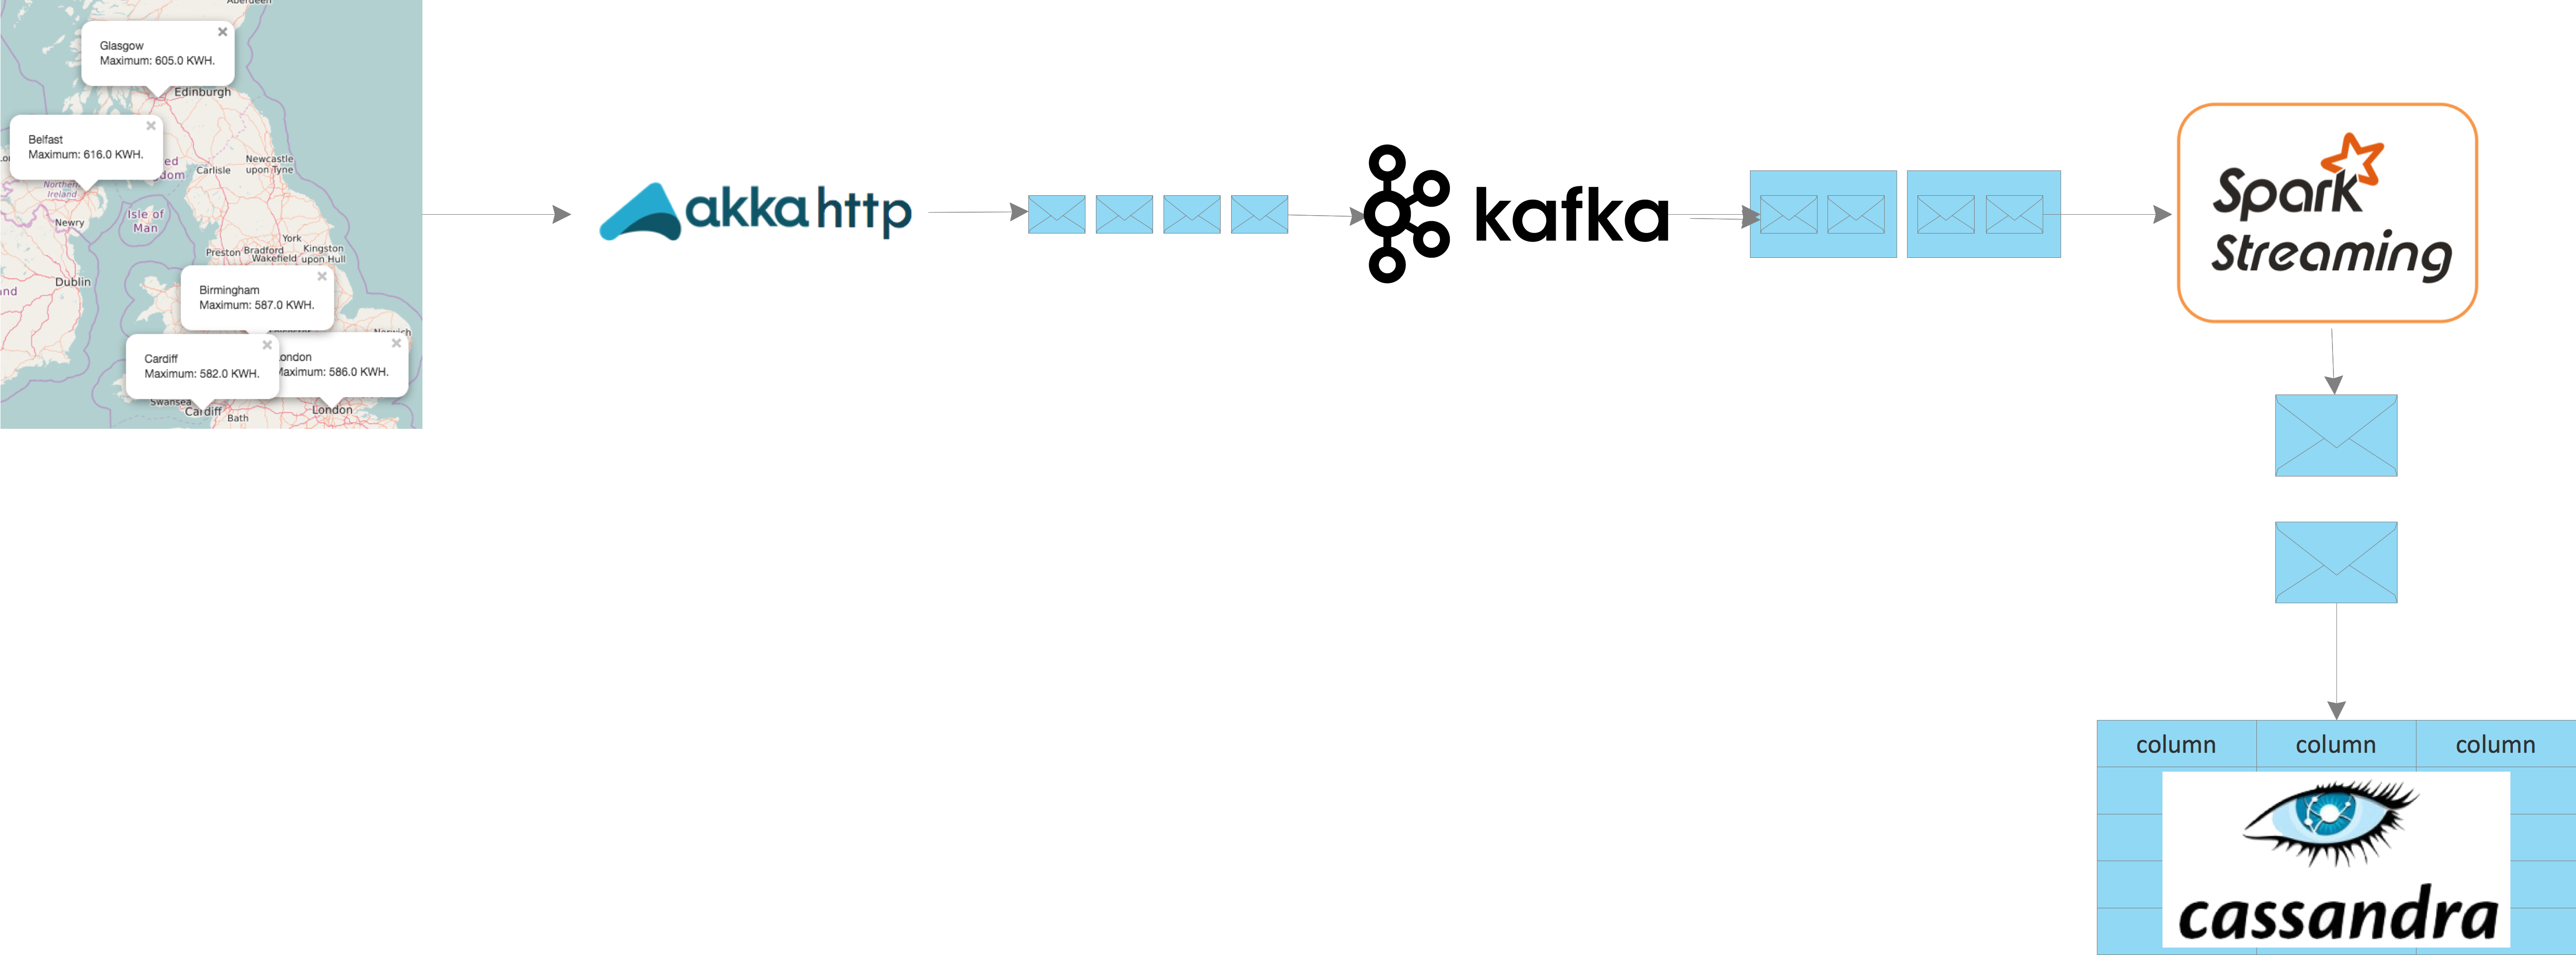
The diagram below depicts the high level schematic of the solution,

- Meter readings are received using a reactive HTTP framework implemented using AKKA HTTP. AKKA HTTP is a full stack HTTP client and server infrastructure implemented on top of AKKA streams, for providing high performant, scalable and asynchronous HTTP.
- Readings received over HTTP, are published by the AKKA HTTP actor to a Kafka distributed topic for downstream processing. Kafka is a high-performant distributed messaging system, which can support reads and writes in the order of hundreds of megabytes per second across thousands of concurrent clients.
- Each message published to the Kafka topic corresponds to a discrete reading from a smart meter. This data is read and summarised based on the city and a time window using Spark streaming. Spark streaming allows you to process a discrete stream of events on a time slice, using the same programming model of RDD (Resilient Distributed Dataset), as you would use for batch processing.
- The summarised data is then saved from the RDD to a Cassandra table for providing dashboard functionality. Apache Cassandra is a scalable fault-tolerant high performant database, that can support petabytes of data, with builtin mechanisms for handling time series analysis of data.
Implementation
The use case implemented using a standard SBT scala project. In this section, we will look at the various code artefacts.
Build Definition
The snippet below shows the build definition, that includes dependencies for,
- Spark Streaming
- Apache Kafka Client
- Kafka-Spark Integration
- Kafka-Cassandra Integration
- AKKA HTTP
name := "spark-kafka"

version := "1.0"

scalaVersion := "2.11.8"

libraryDependencies += "org.apache.kafka" % "kafka-clients" % "0.10.0.0"

libraryDependencies += "org.apache.spark" % "spark-streaming-kafka-0-8_2.11" % "2.0.0"

libraryDependencies += "org.apache.spark" % "spark-core_2.11" % "2.0.0"

libraryDependencies += "org.apache.spark" % "spark-streaming_2.11" % "2.0.0"

libraryDependencies += "org.apache.spark" % "spark-sql_2.11" % "2.0.0"

libraryDependencies += "com.typesafe.akka" %% "akka-http-core" % "2.4.7"

libraryDependencies += "com.typesafe.akka" %% "akka-http-experimental" % "2.4.7"

libraryDependencies += "com.datastax.spark" %% "spark-cassandra-connector" % "2.0.0-M3"
Receiving Meter Readings
The snippet below shows the AKKA HTTP actor for receiving the readings. The readings are comma-separated record including the city, a unique meter Id and the current power usage in KWH. The code below starts a standalone server on port 8080 and binds an actor that reads the data and publishes it to a Kafka topic.
package com.ss.scala.spark

import java.util.Properties

import akka.actor.ActorSystem
import akka.http.scaladsl.Http
import akka.http.scaladsl.model.{ContentTypes, HttpEntity}
import akka.http.scaladsl.server.Directives._
import akka.stream.ActorMaterializer
import org.apache.kafka.clients.producer.{KafkaProducer, ProducerRecord}
import org.apache.kafka.common.serialization.StringSerializer
import scala.io.StdIn
import java.util.UUID

/**
 * Created by meeraj on 10/09/16.
 */
object ReadingsReceiver extends App {

  type PR = ProducerRecord[String, String]

  val props = new Properties();
  props.put("bootstrap.servers", "localhost:9092");
  props.put("key.serializer", classOf[StringSerializer].getCanonicalName);
  props.put("value.serializer", classOf[StringSerializer].getCanonicalName);

  implicit val system = ActorSystem("readings-data-receiver")
  implicit val materializer = ActorMaterializer()
  implicit val executionContext = system.dispatcher

  val producer = new KafkaProducer[String, String](props);

  val route =
    post {
      path("") {
        entity(as[String]) { payload =>
          val rec = new PR("readings", 0, UUID.randomUUID().toString, payload)
          producer.send(rec)
          complete(HttpEntity(ContentTypes.`text/html(UTF-8)`, ""))
        }
      }
    }

  val bindingFuture = Http().bindAndHandle(route, "localhost", 8080)

  println(s"Server online at http://localhost:8080/\nPress RETURN to stop...")
  StdIn.readLine()

  bindingFuture.flatMap(_.unbind()).onComplete { _ =>
    producer.close()
    system.terminate()
  }

}
Aggregating the Readings
On the other side of the Kafka topic, we have Spark streaming consuming the messages on a time window, grouping by city and aggregating the total for the current window and location. This is then written to a Cassandra table.
package com.ss.scala.spark

import org.apache.spark._
import org.apache.spark.streaming._
import org.apache.spark.streaming.kafka._
import com.datastax.spark.connector._

/**
 * Created by meeraj on 10/09/16.
 */
object ReadingsAggregator extends App {

  System.setProperty("spark.cassandra.connection.host", "127.0.0.1")

  val conf = new SparkConf().setMaster("local[2]").setAppName("readings-data-aggregator")
  val ssc = new StreamingContext(conf, Seconds(5))

  val host = "localhost:2181"
  val topic = "readings"

  val lines = KafkaUtils.createStream(ssc, host, topic, Map(topic -> 1)).map(_._2)
  val pairs = lines.map(l => l.split(",")).map(a => a(0) -> a(2).toDouble)
  val rec = pairs.reduceByKey((a, x) => a + x).foreachRDD { rdd =>
    rdd.saveToCassandra("demo", "power_usage", SomeColumns("location", "usage"))
  }

  ssc.start()
  ssc.awaitTermination()

}
The Cassandra table stores the location, even time and temperature statistics.
create keyspace demo with
replication = { 'class' : 'SimpleStrategy', 'replication_factor' : 1 };

create table demo.power_usage (
    location text primary key,
    usage text
);
Power Usage Dashboard
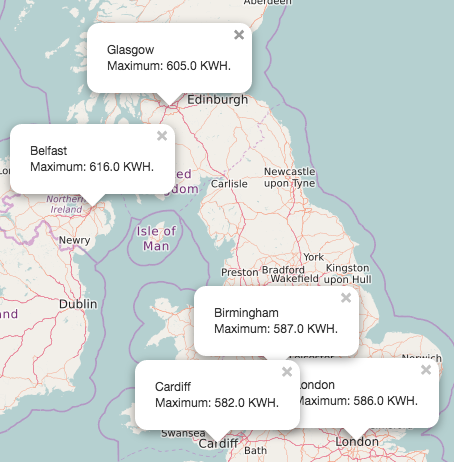
The dashboard is implemented using an AKKA HTTP actor that reads summarised data from Cassandra and serves a templated HTML, that uses LeafLet JS and OpenStreetData for visualisation. The actor is bound to a standalone HTTP service that listens of port 8080.
package com.ss.scala.spark

import akka.actor.ActorSystem
import akka.http.scaladsl.Http
import akka.http.scaladsl.model.{ContentTypes, HttpEntity}
import akka.http.scaladsl.server.Directives._
import akka.stream.ActorMaterializer
import com.datastax.driver.core.{Cluster, Row}

import scala.collection.mutable.ListBuffer
import scala.io.{Source, StdIn}

/**
  * Created by meeraj on 10/09/16.
  */
object ReadingsDashboard extends App {

  System.setProperty("spark.cassandra.connection.host", "127.0.0.1")

  implicit val system = ActorSystem("readings-data-dashboard")

  implicit val materializer = ActorMaterializer()
  implicit val executionContext = system.dispatcher

  val html = Source.fromInputStream(getClass.getClassLoader.
    getResourceAsStream("dashboard.html")).mkString
  val cluster = Cluster.builder().
    addContactPoint("localhost").withPort(9042).build()

  val route =
    get {
      path("") {
        val session = cluster.connect()
        val rows = session.execute("select location, usage from demo.power_usage").all()
        val rec = new ListBuffer[Row]
        for (i <- 0 until rows.size)  rec += rows.get(i)
        val map = rec.map(r => r.getString(0) -> r.getString(1)).toMap
        session.close
        complete(HttpEntity(ContentTypes.`text/html(UTF-8)`,
          html.format(map("London"), map("Birmingham"), map("Glasgow"), map("Cardiff"), map("Belfast"))))
      }
    }

   val bindingFuture = Http().bindAndHandle(route, "localhost", 7080)

   println(s"Server online at http://localhost:9080/\nPress RETURN to stop...")
   StdIn.readLine()
   bindingFuture.flatMap(_.unbind()).onComplete(_ => system.terminate())

 }
The is the Javascript snippet from the HTML code that uses LeafLet JS to plot the power usage on a map, please refer to the source code for the full HTML.
var mymap = L.map('mapid').setView([53.777, -3.500], 6.5);
L.tileLayer('http://{s}.tile.openstreetmap.org/{z}/{x}/{y}.png', {
    maxZoom: 18,
    attribution: '',
    id: 'mapbox.streets'
}).addTo(mymap);

popup1 = new L.Popup();
popup1.setLatLng(new L.LatLng(51.507, -0.129));
popup1.setContent('London
Maximum: %s KWH.

');

popup2 = new L.Popup();
popup2.setLatLng(new L.LatLng(52.486, -1.890));
popup2.setContent('Birmingham
Maximum: %s KWH.

');

popup3 = new L.Popup();
popup3.setLatLng(new L.LatLng(51.486, -3.179));
popup3.setContent('Cardiff
Maximum: %s KWH.

');

popup4 = new L.Popup();
popup4.setLatLng(new L.LatLng(55.864, -4.251));
popup4.setContent('Glasgow
Maximum: %s KWH.

');

popup5 = new L.Popup();
popup5.setLatLng(new L.LatLng(54.597, -5.930));
popup5.setContent('Belfast
Maximum: %s KWH.

');

mymap.addLayer(popup1).addLayer(popup2).addLayer(popup3).addLayer(popup4).addLayer(popup5);
Client Simulator
The client simulator uses a simple shell script, that can be periodically run to generate random test data.
for i in London Cardiff Birmingham Glasgow Belfast
do
  for j in {1..10}
  do
    curl --data "$i,$j,$((10*j + RANDOM % 10))" http://localhost:8080 &
  done
done
Running the Demo
Before you can run the demo,
- Install Apache Kafka: You can download and install the latest tar ball from the Apache Kafka site
- Install Apache Cassandra: You can download and install the latest tar ball from the Apache Cassandra site
- Checkout the source code from GitHub
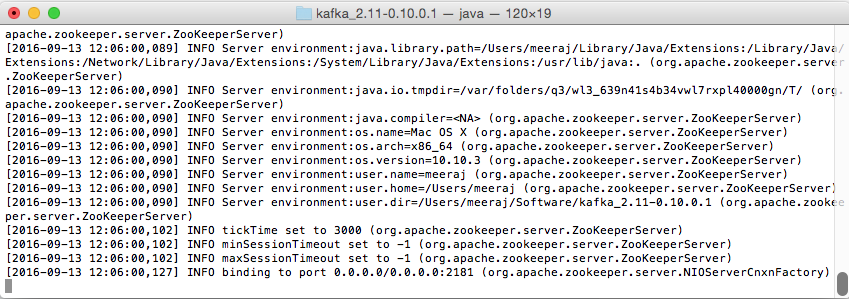
Start Zookeeper
Before you can start Kafka, you need to start Zookeeper using the following command from the Kafka installation directory,
bin/zookeeper-server-start.sh config/zookeeper.properties

Start Kafka
Next you can start Kafka using the following command,
bin/kafka-server-start.sh config/server.properties
You don’t need to explicitly create the topic, Kafka will create it on demand.

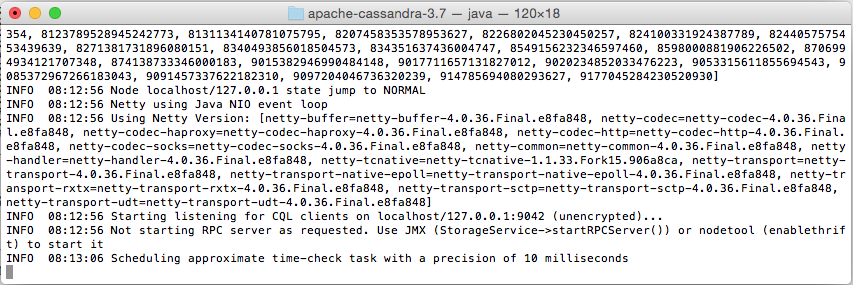
Start Cassandra
To start Cassandra in the foreground as a single node, run the following command from the Cassandra installation directory,
bin/cassandra -f

Install the Schema
Login to CQL and install the schemas as shown below (you can find the scripts in the checked out source code),
bin/cqlsh localhost

Start the Data Receiver
Now that we have Kafka and Cassandra running, we can start the data receiver. Change to the root of the source code directory and run the following command,
sbt run
Choose the option for the ReadingsReceiver object,

Start the Data Aggregator
Start the readings aggregator with the following command,
sbt run
Choose the option for the ReadingsAggregator object,

Start the Dashboard
With the receiver and aggregator running, start the dashboard server,
sbt run
Choose the option for the ReadingsDashboard object,

Run the Simulator
Open the browser pointing to http://localhost:7080 and run the simulator script a few times,
sh ./readings_simulator.sh

You should be able to see the data accumulating in the Cassandra table through CQL,

Also, you will be able to view the live update of the current power usage on the browser window,


Thanks for helping me to see things in a diefnreft light.